Contents
Chapter 1. Theory of statistical arbitrage
Pure arbitrage and statistical arbitrage
Statistical arbitrage trading strategy
Chapter 2. PhD-trader analytical platform
Correlation & cointegration analysis
Chapter 3. Recommendations about using of the platform
List of strategies available for backtesting and optimization in PhD-trader
How to interpret backtest results
Differential Evolution optimization
Appearance of PhD-trader interface
Chapter 1. Theory of statistical arbitrage
Pure arbitrage and statistical arbitrage
Arbitrage is a profitable business in global hedge funds. There are two types of arbitrage in financial markets: pure arbitrage and statistical arbitrage. Pure arbitrage in theory assumes extracting a risk-less profit. When two fungible assets are traded at different prices there can be a pure arbitrage opportunity.
Pure arbitrage exists rarely, however statistical arbitrage provides many attractive opportunities for an arbitrageur that can accept some risk. The idea of statistical arbitrage is that an arbitrageur finds two assets whose prices have a historical interrelation, opens opposite positions in this pair when this interrelation is temporary interrupted and realize a profit when interrelation is restored.
Statistical arbitrage refers to the active portfolio management aimed to generate positive alpha (excess return above market benchmark) systemically. However, under the Efficient Market Hypothesis (EMH), which was the prevalent financial theory for around fifty years, such approach is useless as it is impossible to beat an efficient market [5].
The fundamental financial market theory was challenged in 2004 by Andrew Lo by his innovative theory, which he has named the Adaptive Markets Hypothesis (AMH) [4]. The AMH considers the financial market like ecosystem, where different groups of investors or single investors compete for scarce resources, i.e. profits, and it takes place in the dynamically changing environment. The environment includes such factors as technologies, demography, policy, market path, etc. In this way the AMH applies the principles of evolution – competition, adaptation and natural selection to financial markets.
The evolutionary dynamics, which is assumed by the AMH, determines the variability of the market efficiency, i.e. the market is often inefficient, behavioral biases abound and they can be profitably exploited [3].
Statistical arbitrage trading strategy
The essence of statistical arbitrage is trading a spread between two financial instruments which prices are historically correlated. When prices are positively correlated they tend to move more or less in the same direction most part of time. A spread is the difference between prices of two financial instruments (leg 1 and leg 2) which can be modeled in different ways. Another criteria of a historical relation between two financial instruments similar to correlation is cointegration. Prices are cointegrated when a spread is stationary from historical perspective, i.e. has mean-reverting behavior and statistical arbitrage usually has better performance when it is applied to cointegrated pairs.
The idea is to select such pair, calculate a spread and when the spread deviates from its historical mean to some significant extent, SELL SHORT [2] the expensive instrument and BUY LONG the cheap instrument and close positions when the spread reverts to mean or when goes to deviation of the opposite side.
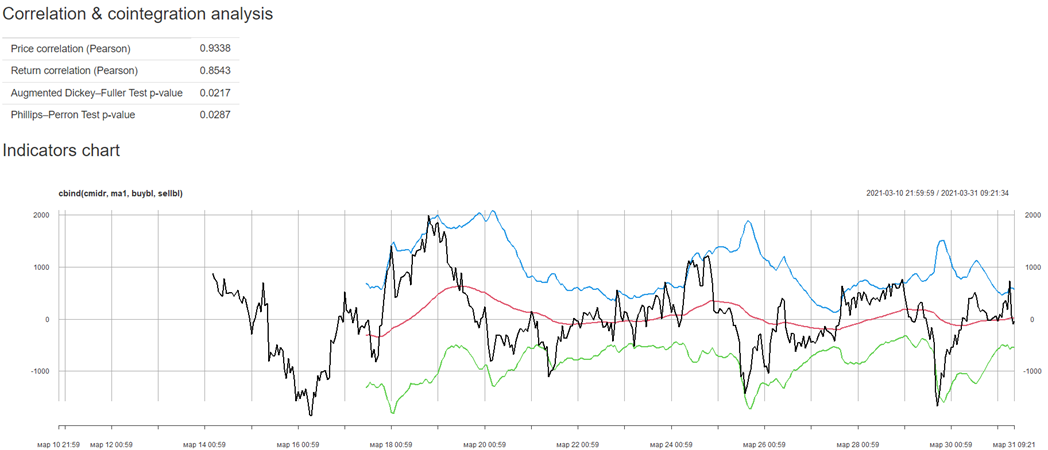
Here is an example (Figure 1).
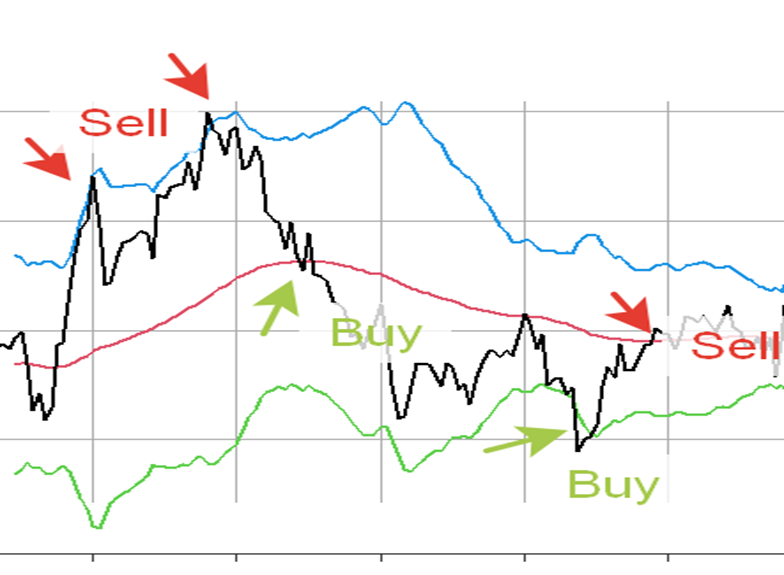
Figure 1. Indicators and signals for a statistical arbitrage trading strategy.
There are 4 lines in the Figure 1. Black line represents a spread between leg 1 and leg 2. Red line represents the mean level of the spread, which is moving average. Blue and green lines are upper and lower bands and they serve as triggers for opening the positions when they are crossed by the spread line.
An arbitrager will sell the spread, that is sell leg 1 and buy leg 2 at the first arrow, increase the arbitrage position at the second arrow and close all positions at mean reversion by buying the spread at first green arrow. Then arbitrageur will enter a long position in the spread at the time of second green arrow and close all positions at the time of the last red arrow. It is not obligatory that position are closed at mean (red line), we just presented here such model.
Chapter 2. PhD-trader analytical platform
PhD-trader is an electronic platform for historical analysis and optimization of different statistical arbitrage trading strategies. It is created by a person who is a PhD in Economics and a financial trader. Main users of PhD-trader are algorithmic traders and scientists.
PhD-trader consists of the 3 parts: Constructor, Backtester and AI-Optimizer. Constructor is for constructing a strategy based on selected models, parameters and financial instruments data. Backtester is for backtesting a strategy, constructed in Constructor and getting performance measures as a result. AI-Optimizer is for parameters optimization of a strategy, constructed in Constructor based on the non-linear multidimensional optimization algorithm of Differential Evolution which refers to Genetic Algorithms, the division of Artificial Intelligence.
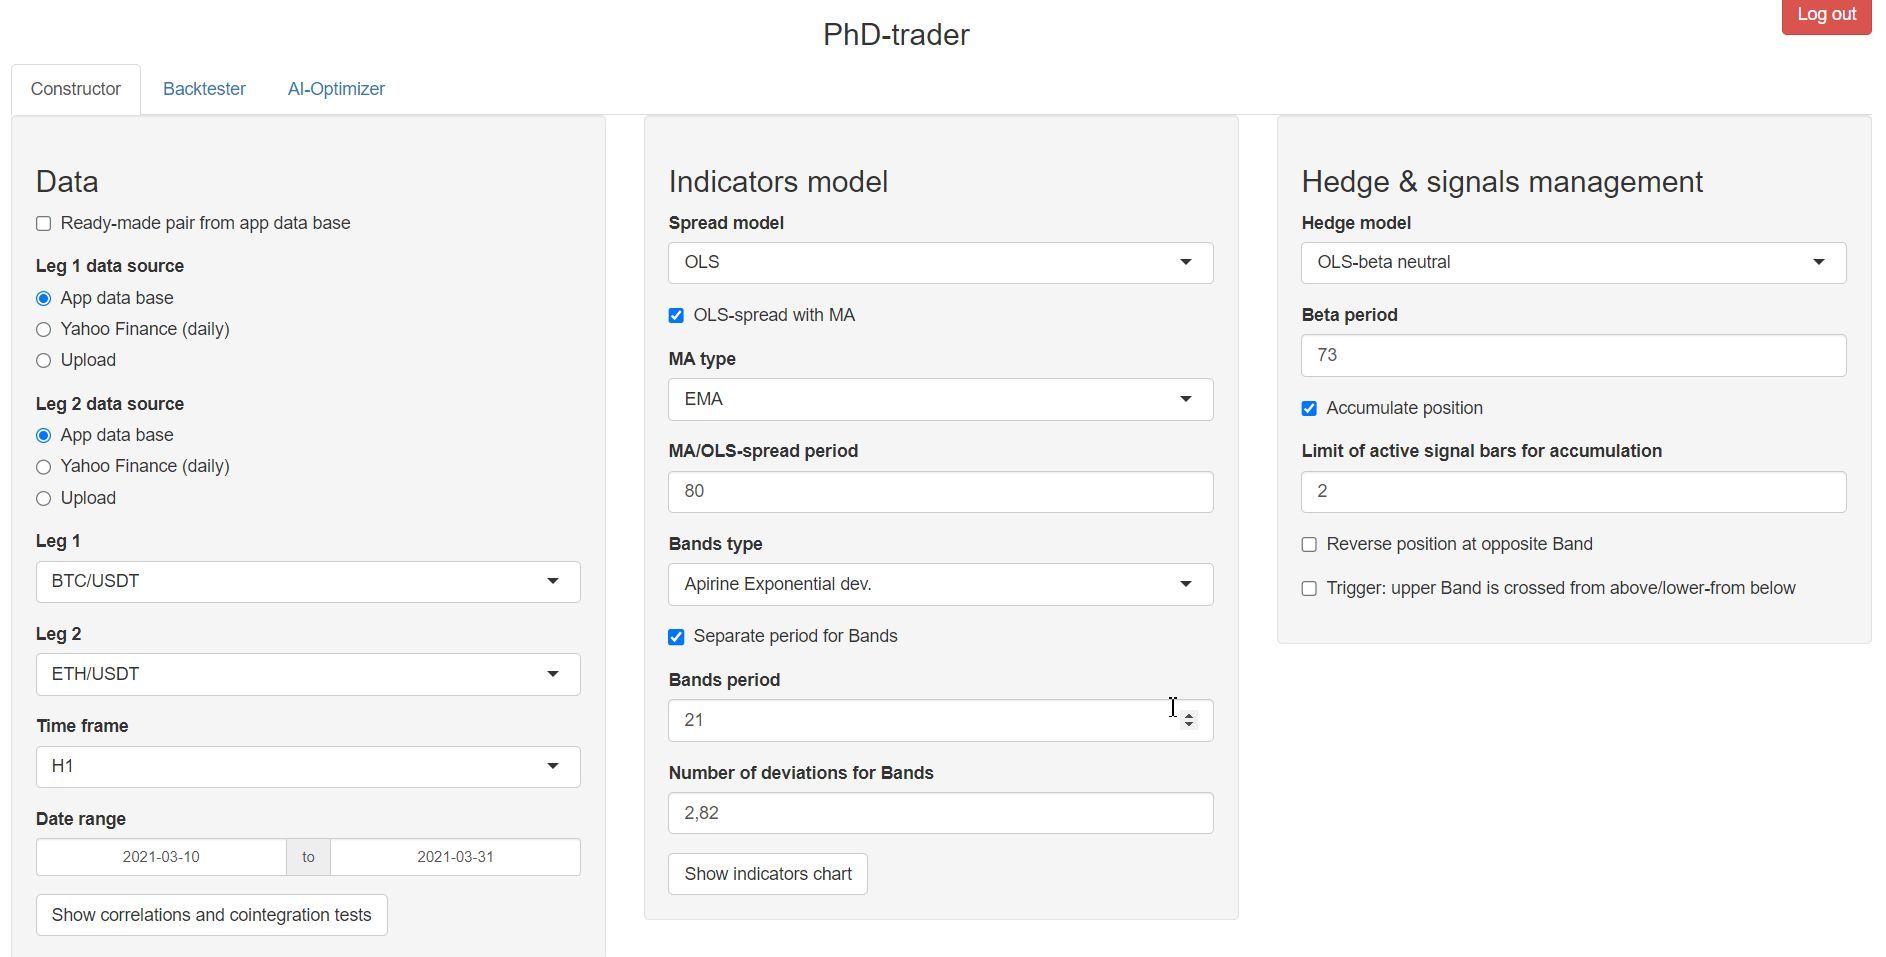
Constructor has the 3 input panels (Data, Indicators model and Hedge & signals management) and the possibility to display the Correlation and cointegration analysis of the pair and the Indicators chart.
In the Data panel price time series of a pair of financial instruments for a backtest are prepared. The user can display the Correlation and cointegration analysis of the pair by pushing the appropriate button.
In the Indicators model the user can create many combinations of indicators of different type with different parameters. The user can display the Indicators chart by pushing the appropriate button.
In the Hedge & signals management panel the user selects the order sizing logic for the Leg 2 and some aspects of the trading signals logic.
Ready-made pair from app data base: if this checkbox is checked, the user selects a ready-made statistical arbitrage pair from app data base for a backtest.
Leg 1 data source: a source of price time series data for the 1st leg of statistical arbitrage pair for a backtest. Pay attention that in the case of forex pairs leg 1 and leg 2 should have the same quote currency.
App data base: if this checkbox button is checked, the user selects price time series data for the 1st leg from the PhD-trader’ data base. The number 2 at the end of some currency pair names means data for June 2025, and the number 3 means data for July 2025.
Yahoo Finance (daily): if this radio button is checked, the user imports price time series data for the 1st leg from Yahoo Finance by entering a ticker (symbol) of a desired instrument and pushing the button “Get data for leg 1”. Only daily time frame is available. Only Adjusted Close data is considered (without Open and others) from Yahoo, so that a new position is open at the next Adjusted Close price after the signal bar. See available tickers in finance.yahoo.com.
Upload: if this radio button is checked, the user uploads price time series data for the 1st leg from .xls, .xlsx, .csv or .txt file.
Choose leg 1 file
Browse: click here to select a file from a user’s PC folder. User should provide a data file, which has date as a first column and next columns should coincide with names of one of the 5 acceptable formats: OHLC (Open, High, Low, Close), OC (Open, Close), BBO (price_bi.d, price_as.k), bbo_ready (price_bi.d, price_as.k, p_micro) or univariate (univariate times series, which has only 2 columns – date and price series). price_bi.d coincides with bid price, price_as.k coincides with ask (offer) price, whereas p_micro coincides with price, which is used for calculation of indicators and triggers (for example it can be mid-price or micro-price). The time series of both legs should be of the same time zone. The time zone of app data base is UTC. In app data base timestamp 23:59 means a time of the close of 23:58-23-59 time period. This timestamp system should coincide for both legs data sources.
Leg 2 data source: analogical to leg 1.
App data base
Yahoo Finance (daily)
Upload
Choose leg 2 file
Browse
Clear: push this button to remove the uploaded files.
Time frame: select one of the 7 possible time frames: S10 – 10-seconds, M1 – 1-minute, M5 – 5-minutes, M15 – 15-minutes, M30 – 30-minutes, H1 – 1-hour, D1 - daily.
Date range: enter start and end date of the desired period of the price time series data for a backtest.
Show correlations and cointegration tests: push this button to show Correlation & cointegration analysis of the pair.
Spread model: select 1 of the 3 presented ways to model price difference between financial instruments.
Price ratio: to get the Price ratio time series we divide the price of the leg 1 by the price of the leg 2 at the each time point.
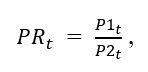
where:
PRt – Price ratio at time t;
P1t – Price of leg 1 at time t;
P2t – Price of leg 2 at time t.
Log-price ratio: to get the Log-price ratio time series we divide the log-price of the leg 1 by the log-price of the leg 2 at the each time point.
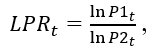
where:
LPRt – Log-price ratio at time t;
P1t – Price of leg 1 at time t;
P2t – Price of leg 2 at time t.
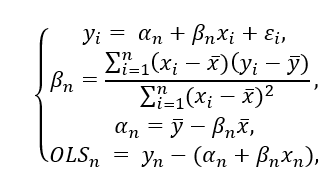
OLS residuals: to get the time series of spread based on OLS-residuals we subtract the theoretical (model) price of the leg 1 from its actual price. The theoretical price is modeled trough the Ordinary Least Squares rolling regression of the prices of the leg 1 on the prices of the leg 2.

OLS-spread with MA: if the OLS spread model is selected and this checkbox button is checked, a moving average of OLS-spread with the same lookback period would be considered for mean-reversion instead of static zero level.
MA type: select 1 of the 2 moving average types.
SMA: the simple moving average, that is rolling arithmetic mean for period stated in MA/OLS-spread period.
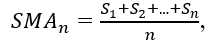
where:
SMAn – SMA of the spread at the time of the last observation of the spread in the window;
Sn – the value of the spread at period n;
n – the number of total periods (lookback period).
EMA: exponentially weighted moving average for period stated in MA/OLS-spread period.
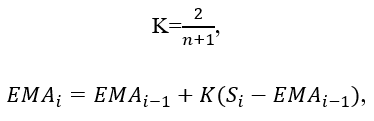
where:
K – multiplier;
EMAi – the current value of the EMA of the spread;
n – the EMA period;
EMAi-1 – the previous value of the EMA (the first value of the EMA time series equals an SMA of the same period) of the spread;
Si – the current value of the spread indicator.
MA/OLS-spread period: the lookback period for a moving average and/or the OLS-spread rolling regression if OLS is selected.
Bands type: select 1 of the 2 methods to calculate the trigger lines (upper and lower bands). Signal for opening the position is active when the spread is higher or equal to the higher band or lower than or equal to the lower band.
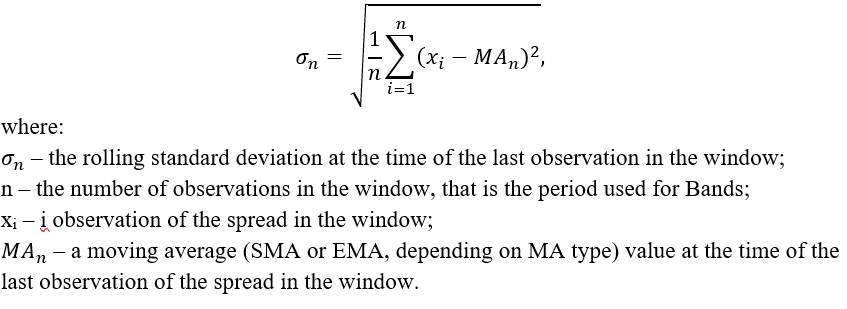
Standard dev.: the rolling population standard deviation of the spread with the same period as the MA/OLS-spread period, however if Separate period for Bands is checked, its period will be taken from the Bands period.
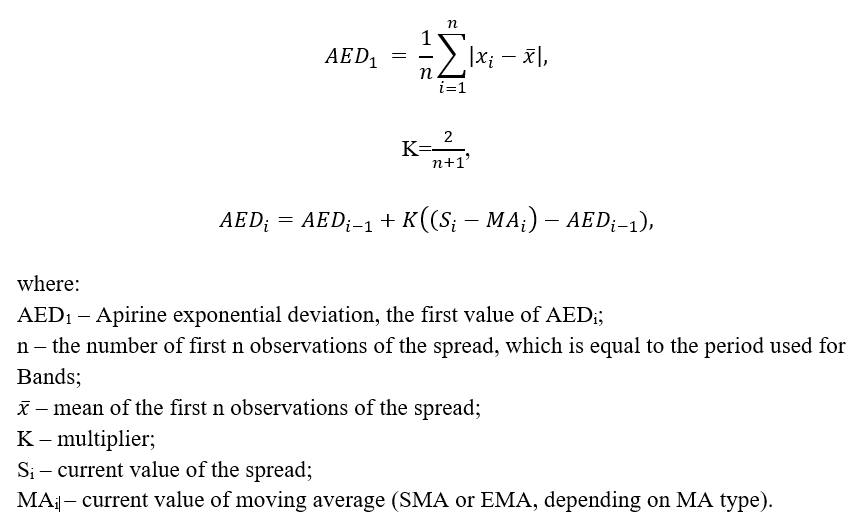
Apirine Exponential dev: the exponentially weighted rolling mean absolute deviation [7] of the spread with the same period as the MA/OLS-spread period, however if Separate period for Bands is checked, its period will be taken from the Bands period.
Separate period for Bands: if this checkbox button is checked, the user sets the Bands period separately so that it could be different from the MA/OLS-spread period.
Bands period: the lookback period for the rolling Standard dev. or the Apirine exponential dev. if Separate period for Bands is checked.
Number of deviations for Bands: number of standard deviations or exponential mean absolute deviations (if Apirine Exponential dev is selected) to add to mean to get Bands. It can be non-integer.
Show indicators chart: press this button to display indicators, calculated based on the set models and the parameters above.
Hedge model: select 1 of 2 presented methods to calculate hedge ratios for pair trades.
Dollar neutral: if this method is selected, the order size of the leg 2 is calculated based on the dollar-neutrality principle, so that the resulting position cash size of the leg 2 equals a position cash size of the leg 1.
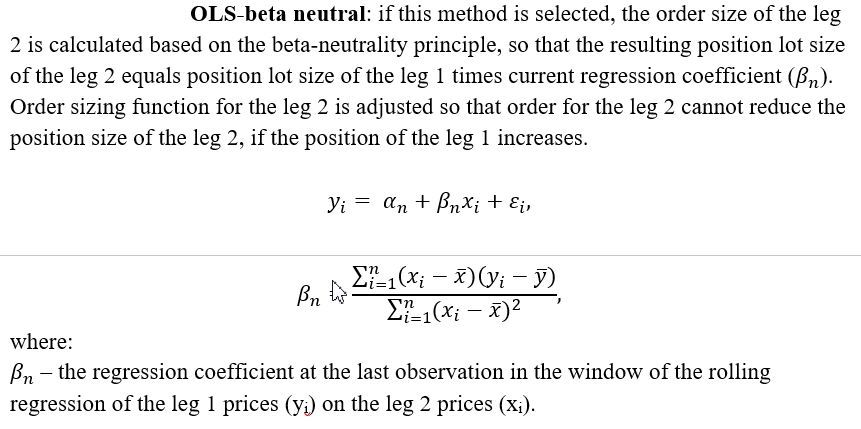
Beta period: this option appears if the OLS-beta neutral hedge model is selected. Set a lookback period for rolling OLS-beta.
Accumulate position: if this checkbox is checked, there is an opportunity for a gradual accumulation of a position during the time, when trigger conditions are satisfied.
Limit of active signal bars for accumulation: new orders to accumulate a position will be simulated each new active signal bar until their accumulated quantity would not achieve this limit.
Reverse position at the opposite band: if this checkbox is checked, the position is closed and reversed at the same time (taking into account new hedge ratios) when the spread indicator achieves the opposite band. If this checkbox is unchecked the position is closed when the spread indicator reverts to mean, that is moving average or zero in case of OLS-spread without MA.
Trigger: upper Band is crossed from above/lower-from below: if this checkbox is checked, positions are open when the spread indicator crosses upper band from above instead of from below and when spread indicator crosses lower band from below instead of from above.
Correlation & cointegration analysis:
push Show correlations and cointegration tests button to display this table with 4 measures.
Price correlation (Pearson): Pearson correlation coefficient, which shows the correlation between prices of the legs 1 and 2.
Return correlation (Pearson): Pearson correlation coefficient, which shows the correlation between log returns of prices series of the legs 1 and 2.
Augmented Dickey–Fuller (ADF) Test p-value: most commonly used test for cointegration of the pair. If a p-value is lower than 0.1 or 0.05 times series considered to be cointegrated, because it means that their linear combination is stationary.
Phillips–Perron Test p-value: another test for cointegration. If a p-value is lower than 0.1 or 0.05 times series considered to be cointegrated, because it means that their linear combination is stationary.
push Show indicators chart button to display this chart.
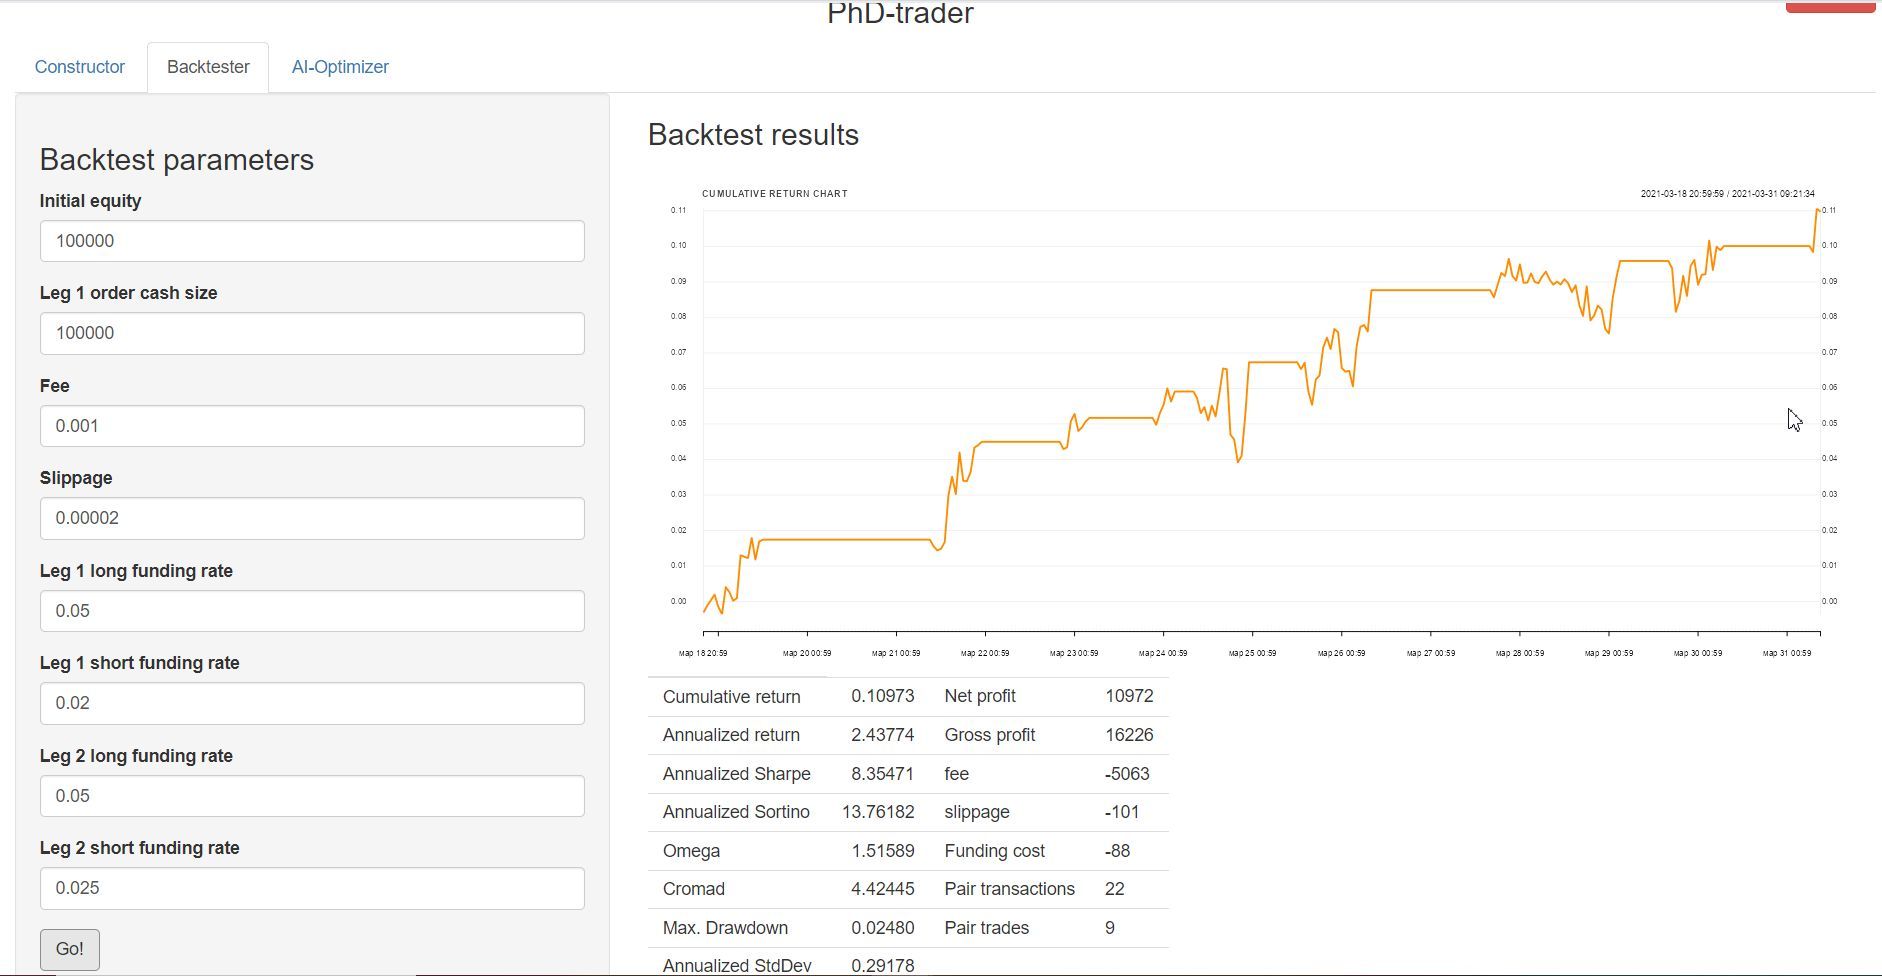
Initial equity: money belonging to a trader and deposited on a broker's account before trading.
Leg 1 order cash size: the cash value of 1 order for opening the position or accumulation of the position for the leg 1. The order size in lots is adjusted to comply with this value, however it is adjusted only for the first transaction of the trade, so that leg 1 lot size of any new order due to accumulation will be the same as for the first transaction.
Fee: trading fee rate needed to calculate the sum of money paid to a broker and an exchange after each transaction. The entered number should be in units, not in percentages. If the fee is positive, that is exchange pays you money for turnover, put “minus” (-) before the fee rate figure.
Slippage: fraction of financial instrument price needed to calculate sum of money lost each transaction due to slippage. Slippage is the difference between the expected price of an order and the price when the order actually executes. It is reasonable to set slippage if data is not in BBO format. The entered number should be in units, not in percentages. If the slippage is positive, that is you want to model the case when market provides you better price than expected, put “minus” (-) before the slippage figure.
Leg 1 long funding rate: an annual interest rate, at which borrowed money are borrowed to fund a long leveraged position in the leg 1. In the case of a forex pair with positive swap or negative borrowing rate, put “minus” (-) before the interest rate figure. The entered number for each funding rate should be in units, not in percentages. If you don’t want to take into account funding rates, put 0 value, but do not leave it blank to avoid errors.
Leg 1 short funding rate: an annual interest rate, at which borrowed money/assets are borrowed to fund a short position in the leg 1. In the case of a forex pair with positive swap or negative borrowing rate, put “minus” (-) before the interest rate figure.
Leg 2 long funding rate: an annual interest rate, at which borrowed money are borrowed to fund a long leveraged position in the leg 2. In the case of a forex pair with positive swap or negative borrowing rate, put “minus” (-) before the interest rate figure.
Leg 2 short funding rate: an annual interest rate, at which borrowed money/assets are borrowed to fund a short position in the leg 2. In the case of a forex pair with positive swap or negative borrowing rate, put “minus” (-) before the interest rate figure.
Go!: push this button to launch a backtest with the parameters set in Constructor and Backtester.
Cumulative return chart: cumulative return chart based on simple chaining.
Cumulative return: cumulative return based on simple chaining earned for the period of a backtest.
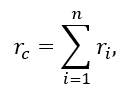
where:
rc – cumulative return;
ri – return for the i- period.
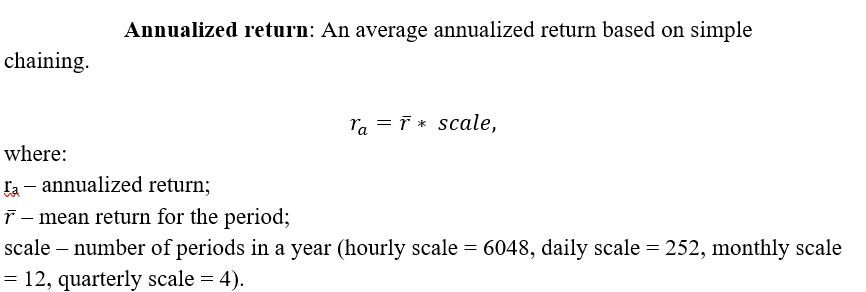
Annualized return: An average annualized return based on simple chaining.
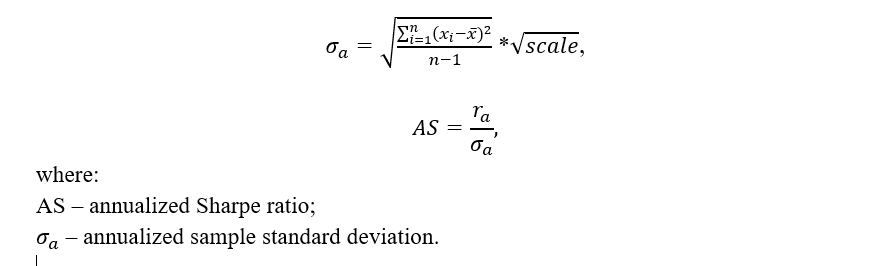
Annualized Sharpe: the most commonly used in the industry of algotrading risk-adjusted performance indicator. It is calculated as a ratio of annualized return to annualized volatility (standard deviation) of returns. Standard deviation serves here as a risk measure. The higher Sharpe ratio the better.
Annualized Sortino: risk-adjusted performance measure similar to Sharpe ratio, however it penalizes only for a down-side risk (volatility). The higher Sortino ratio, the better.
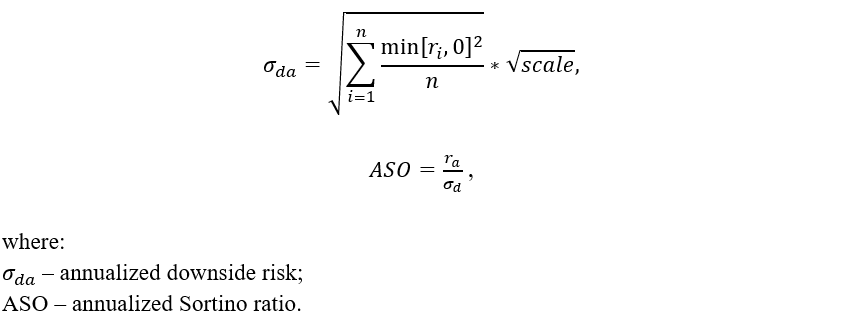
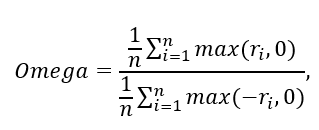
Omega: this risk-adjusted performance measure is the returns distribution probability-weighted upside potential divided by probability-weighted downside potential given a minimum acceptable return level, which we set to be equal to zero. The higher the Omega ratio, the better. If Omega ratio is equal to or less than 1 the strategy is unprofitable.
Cromad: this risk-adjusted performance measure is the ratio of cumulative return over maximum drawdown, which represents the risk of backtested strategy. Drawdowns are measured as a percentage of peak equity. The higher Cromad, the better.
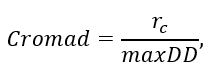
where:
rc – cumulative return;
maxDD – maximum drawdown.
Max. Drawdown: maximum drawdown. Drawdowns are measured as a percentage of peak equity. Risk measure. The lower Max. Drawdown the better.
Annualized StdDev: annualized standard deviation of returns. It is calculated the same as for Annualized Sharpe. Risk measure. The lower Annualized StdDev the better.
Net profit: profit from trades less fee, slippage and funding costs.
Gross profit: net profit plus transaction costs.
fee: sum of commissions paid to a broker and an exchange.
slippage: sum of money lost due to slippage.
Funding cost: sum of money paid to fund short positions and long positions with leverage.
Pair transactions: number of pair transactions for a backtest period.
Pair trades: number of pair trades, that is the number of times an open position had been closed.
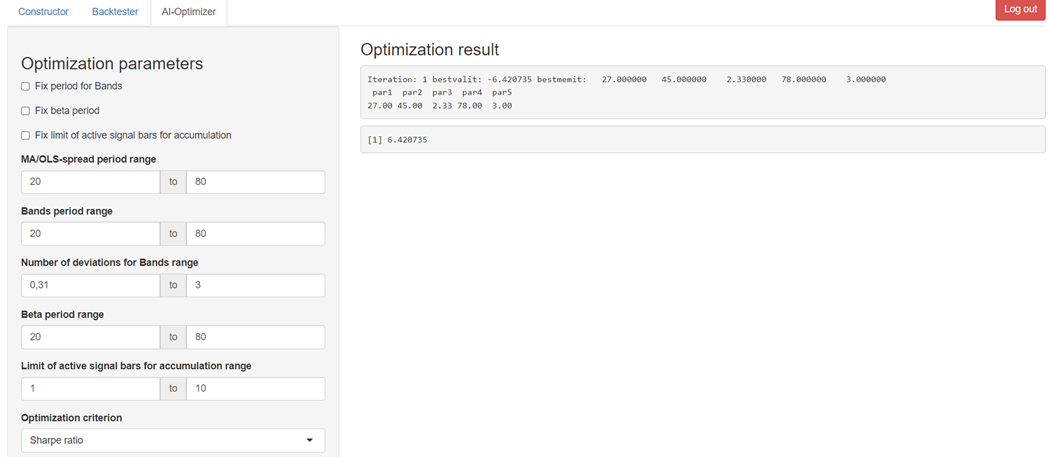
Fix period for Bands: this checkbox appears only when Separate period for bands in Constructor is checked. If this checkbox is checked, period for Bands will not be optimized and will remain equal to value stated in Constructor during all iterations.
Fix beta period: this checkbox appears only when OLS-beta hedge model is selected in Constructor. If this checkbox is checked, Beta period will not be optimized and will remain equal to value stated in Constructor during all iterations.
Fix limit of active signal bars for accumulation: this checkbox appears only when Accumulate position checkbox in Constructor is checked. If this checkbox is checked, Limit of active signal bars for accumulation will not be optimized and will remain equal to value stated in Constructor during all iterations.
MA/OLS-spread period range: this and each of the following 4 items in AI-Optimizer represent a range for a parameter's value to be chosen during optimization iterations. All values for the parameter of this range are rounded to integer.
Bands period range: All values for the parameter of this range are rounded to integer.
Number of deviations for Bands range: All values for the parameter of this range are rounded to 2 decimal places.
Beta period range: All values for the parameter of this range are rounded to integer.
Limit of active signal bars for accumulation range: All values for the parameter of this range are rounded to integer.
Optimization criterion
Sharpe ratio
Omega ratio
Sortino ratio
Cromad ratio
Sharpe ratio X Cromad ratio: this and the following 2 below are combined optimization criteria which take into account performance and risk measures of more than 1 risk-adjusted performance indicator. This criterion is the product of multiplying of Sharpe ratio by Cromad ratio.
Omega ratio X Cromad ratio: This criterion is the product of multiplying of Omega ratio by Cromad ratio.
Sortino ratio X Cromad ratio: This criterion is the product of multiplying of Sortino ratio by Cromad ratio.
Net profit
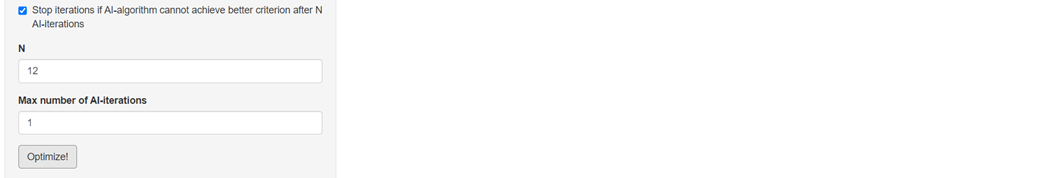
Stop optimization if AI-algorithm cannot achieve better criteria after N AI-iterations: if this checkbox is checked, an optimization would be finished if AI-algorithm cannot achieve better optimization criterion after N AI-iterations.
N: enter here the N number of AI-iterations.
Max number of AI-iterations: enter here max number of AI-iterations at which an optimization would be finished. 1 AI-iteration includes many iterations for many combinations of parameters, because it is based on AI Differential Evolution algorithm.
Optimize!: push this button to launch an optimization based on inputs of Constructor, Backtester and AI-Optimizer. Attention: do not change any input before the end of optimization so that you can know what kind of strategy is optimized and what conditions are assumed. Sometimes you may have to wait several hours for the optimization result.
Here is an example of optimization result:
Iteration: 1 bestvalit: -5.779579 bestmemit: 47.000000 73.000000 2.970000 75.000000 3.000000
Iteration: 2 bestvalit: -5.779579 bestmemit: 47.000000 73.000000 2.970000 75.000000 3.000000
Iteration: 3 bestvalit: -5.805074 bestmemit: 47.000000 73.000000 2.970000 80.000000 3.000000
Iteration: 4 bestvalit: -5.805074 bestmemit: 47.000000 73.000000 2.970000 80.000000 3.000000
Iteration: 5 bestvalit: -5.805074 bestmemit: 47.000000 75.000000 2.970000 80.000000 3.000000
Iteration: 6 bestvalit: -5.805074 bestmemit: 47.000000 75.000000 2.970000 80.000000 3.000000
Iteration: 7 bestvalit: -6.176733 bestmemit: 44.000000 71.000000 2.940000 75.000000 3.000000
par1 par2 par3 par4 par5 #optimized parameters
44.00 71.00 2.94 75.00 3.00
[1] 6.176733 #the best optimization criterion achieved
Chapter 3. Recommendations about using of the platform
PhD-trader platform is a product of years of scientific and practical work. Our experience can help algotraders and researchers to structure their efforts in the best way. First of all we suggest to create a plan of the research. Further we propose an example of such plan.
In PhD-trader it is possible to model 512 statistical arbitrage trading strategies with different combinations of indicators, hedge and signals management logic. Here we prepared a list of all 512 strategies.
List of strategies available for backtesting and optimization in PhD-trader
Objectiveof a research: find the most successful statistical arbitrage trading strategy based on historical data of a pair.
Other possible objectives: find several most successful strategies based on historical data of a pair for adding them into a portfolio of strategies; find most successful pairs for the strategy based on historical data.
Step 1. Select 10 strategies from the list of 512 strategies.
Selected strategies: 1, 99, 114, 148, 200, 205, 349, 400, 412, 444
Step 2. Find 1 pair which has ADF-test p-value 0.05 or less.
Step 3. Do Walk Forward Analysis for each strategy on the pair from the step 2.
Walk Forward Analysis (WFA) is a method of verification of trading strategy performance based on optimization and backtesting. The scheme of this method is presented on the Figure 2.
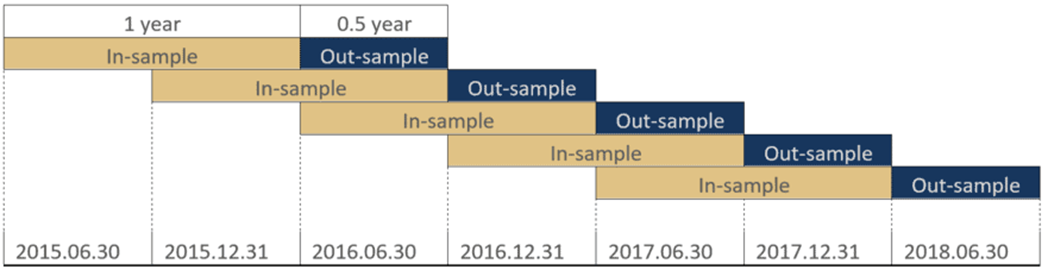
Figure 2: Walk forward optimization chart from 2015.07.01 to 2018.12.31 with 1 year in-sample periods with 0.5 years out-of-sample periods. Source: [1]
Data periods for WFA can be of two types: In-sample and Out-sample. In-sample is a period of data used for a parameter optimization, that is why backtesting on in-sample data is subject to look ahead bias. To avoid this disadvantage of in-sample data, a researcher should preserve some of data after in-sample period, which have not been used for a parameter optimization. This second part of data is called Out-sample.
The process of WFA in PhD-trader looks like this. We will take the example from the Figure 2 above. The researcher has the historical data from 30.06.2015 to 31.12.2018. The period from 30.06.2015 to 30.06.2016 is the first in-sample period, during which the most efficient parameters are defined.
A researcher had chosen the strategy indicators and logic in the Constructor and the Sharpe ratio as an optimization criterion in AI-Optimizer. Than he makes several backtests by pressing Go! button in Backtester to get understanding of which ranges for optimized parameters to set so that to avoid parameters combinations which produce no trades (otherwise AI-Optimizer will produce an error during such iteration) or too few trades.
A researcher entered the dates of the first in-sample period as the date range, set transaction costs as well as other needed parameters in the Backtester, set ranges of parameters for an optimization as well as other appropriate parameters in the AI-Optimizer and pressed Optimize! button.
When the optimization is finished, the researcher take the best combination of parameters, returned in Optimization result, enter them in Constructor and press Go! button in Backtester to get Backtest results for the first in-sample period. A researcher copies them in the Word file for the Backtest results protocols.
Then a researcher set a new date range which reflects the first out-sample period (30.06.2016-31.12.2016) and backtest the same strategy with same parameters. The backtest results are copied into the Word protocol as well.
The second in-sample period will be since 31.12.2015 til 31.12.2016. In-sample window shifts each time by the same period so that a last out-sample period becomes the part of next in-sample period. The cycle is repeated until last out-sample period covers last date of data of the pair. In the end there will be 5 in-sample protocols and 5 out-sample protocols.
How to interpret backtest results
We suggest strategies which have:
Annualized return > 30% (0.3)
Annualized Sharpe ratio > 1
Annualized Sortino ratio > 1
Omega ratio > 1
Cromad > 2
Differential Evolution optimization
“The Differential Evolution is the optimization method inspired by the biological phenomenon of evolution. The considered machine learning method follows the approach of taking the random sample (population) from the solution space (Ψ), disturbing the parameters (mutation of the population characteristics) and creating a new sample from the most profitable strategies (reproduction). The steps are repeated – the new population is created, with the disturbed characteristics similar to the best ones from the previous step” [6].
If you push launch buttons (Go! In Backtester, Show indicators chart and Show correlations and cointegration tests in Constructor or Optimize! In AI-Optimizer) with very small time distance after loading data in Data panel, dates accepted by certain function may not correspond to date range in Data panel because dates in date range have not self-adjsuted in time. If you noticed it in Indicators chart, push Show indicators chart again. If dates in Date range and displayed dates in the Indicators chart correspond to each other, you can be sure that Backtester and AI-Optimizer consume the correct data.
When BTC or ETH is taken from app data base as one of the legs, whereas other leg is taken from Yahoo, it results in no observation with common index. The reason is specificity of time component of date which differs from Yahoo. Avoid such combination of data sources.
If you get such error during optimization: “one node produced an error: 'names' attribute [6] must be the same length as the vector [2]”, it means that one of combination of parameters haven’t produced trades. Tighten some parameter ranges and look which Indicators charts maximum values of ranges have produced being put in Constructor parameters. Adjust parameters so that trigger lines would be crossed and there would also be conditions for exit after triggers for opening the position.
If you get “Error: time frame of an input data cannot be bigger than a selected time frame” it means that selected time frame is smaller than the time frame of input data, whereas it is impossible to transform time series from lower frequency to higher frequency. Select another time frame or change the input data. Pay attention: all data from Yahoo is daily.
If you get “Error: need finite 'ylim' values” after launching a backtest, it means that you forgot to fill funding rates. Put “0” value if you don’t want to take them into consideration.
When you use data, that is obtained throw request to Yahoo Finance, if you entered incorrect symbol, then after pushing the appropriate “Get data for leg…” the app closes.
Performance measurement:
Practical Risk-Adjusted Performance Measurement, C. Bacon, Wiley Finance, 2013
ADF-test:
https://repositorio.ucp.pt/bitstream/10400.14/36905/1/202894487.pdf Pairs Trading Cointegration-based methods Applied to the Cryptocurrency Market, pp 18-19.
Phillips–Perron test:
Phillips, P. C. B.; Perron, P. (1988). Testing for a Unit Root in Time Series Regression. Biometrika, 75 (2): 335-346.
Correlation:
https://www.investopedia.com/terms/c/correlationcoefficient.asp
Differential Evolution, Artificial Intelligence:
https://indiaai.gov.in/article/exploring-differential-evolution-in-ai
-
Lo A.W., Reconciling Efficient Markets with Behavioral Finance: The Adaptive Markets Hypothesis // Journal of Investment Consulting, 2005, V. 7, № 2, p. 21-44.
-
Lo A.W., The Adaptive Markets Hypothesis: Market Efficiency from an Evolutionary Perspective // Journal of Portfolio Management, 2004, V.30, № 5, p. 15-29.
-
Malkiel B.G., Fama E. Efficient Capital Markets: A Review of Theory and Empirical Work // The Journal of Finance, 1970, V. 25, № 2, p. 383-417.
-
P. Ryś, R. Ślepaczuk, Machine Learning Methods in Algorithmic Trading Strategy Optimization – Design and Time Efficiency // Central European Economic Journal, CEEJ 5 • 2018 • 206−229 • ISSN 2543-6821 •https://doi.org/ 10.1515/ceej-2018-0021
-
Stocks & Commodities V. 37:07 (8–14): Exponential Deviation Bands by Vitali Apirine
Log-returns are used for calculation of performance measures.
Leverage is unlimited and is available with negative equity.
In the case of OHLC (Open, High, Low, Close) or OC (Open, Close) format of an input price series data a transaction is executed at Open of a bar next to a signal bar.
In the case of BBO (price_bi.d, price_as.k) and BBO_ready (price_bi.d, price_as.k, p_micro) format of an input price series data and if there had been no transformation into larger time-frame, a buy transaction is executed at price_as.k of a bar next to a signal bar, whereas a sell transaction is executed at price_bi.d of a bar next to a signal bar. Whereas if transformation into larger time-frame occurred, a buy transaction is executed at Open of price_as.k bar, following after signal bar, while sell transaction is executed at Open of price_bi.d bar, following after the signal bar.
In the case of univariate (univariate times series, which has only 2 columns – date and price series) format of an input price series data a transaction is executed at a price of a bar next to a signal bar.
Only Adjusted Close data is considered (without Open and others) from Yahoo, so that a new position is open at the next Adjusted Close price after the signal bar.
Leg 1 order cash size is set by the user in Backtester. It is the cash value of 1 order for opening the position or accumulation of the position for the leg 1. The order size in lots is adjusted to comply with this value, however it is adjusted only for the first transaction of the trade, so that leg 1 lot size of any new order due to accumulation will be the same as for the first transaction.
Leg 2 order size in lots in PhD-trader can be calculated with two different models, one of which is chosen by the user: OLS-beta neutral and Dollar neutral.
OLS-beta neutral: if this method is selected, the order size of the leg 2 is calculated based on the beta-neutrality principle, so that the resulting position lot size of the leg 2 equals position lot size of the leg 1 times current regression coefficient (see formulas in Hedge & signals management). Order sizing function for the leg 2 is adjusted so that the order for the leg 2 cannot reduce the position size of the leg 2, if the position of the leg 1 increases.
Dollar neutral: if this method is selected, the order size of the leg 2 is calculated based on the dollar-neutrality principle, so that the resulting position cash size of the leg 2 equals a position cash size of the leg 1.